
Learn a KPI framework for nonprofits to measure digital marketing ROI from cost per donor to multi-touch attribution and board reporting.
Measuring the success of digital marketing campaigns is often one of the biggest challenges faced by nonprofits. Without the proper framework, it becomes difficult to know which channels are driving donations and which strategies are most effective. By applying a clear, structured approach to measuring return on investment (ROI), nonprofits can make informed decisions on how to optimize their digital strategies and allocate resources more effectively. This blog introduces a KPI framework tailored to nonprofit organizations, focusing on the key metrics that reveal real fundraising performance and ensure every marketing dollar spent contributes to achieving the organization’s goals.
TL;DR
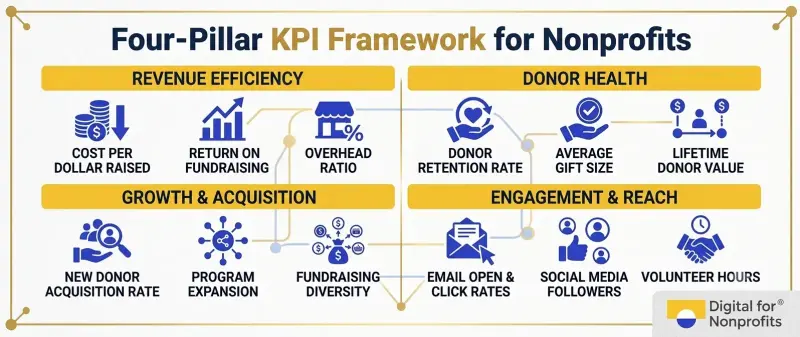
A KPI framework for nonprofits measures impact across four pillars: revenue efficiency, donor health, growth, and engagement
Cost per donor acquired and donor retention rate are the two metrics that unlock sustainable fundraising
Multi-touch attribution shows which channels truly drive donations, preventing costly channel misallocation
Board-ready ROI dashboards (one-page format, quarterly cadence) justify marketing budgets and build stakeholder confidence
The Measurement Gap That's Costing You
Eighty percent of India's top nonprofits score low on digital maturity. Most can name their fundraising goals. Few can answer this question: Which digital channels actually bring donors through the door?
You run an email campaign. A donor sees it. They click. They visit your website. They see a Facebook ad retargeting them. Then, weeks later, they give their first gift. Which channel gets credit? Your email platform says it was email. Facebook says it was the retarget. Google Analytics says it was organic search. Everyone's right. Everyone's also wrong.
This is the attribution problem, and it's why most nonprofits can't prove ROI. Marketing attribution remains nonprofits' biggest ROI challenge. Research shows less than 1 in 4 organizations can confidently tie campaigns to revenue, leading boards to cut budgets when impact isn't proven.
The good news: you don't need enterprise software or a data science team to fix this. You need a clear framework, disciplined tagging, and a reporting habit.
Why Digital Marketing ROI Matters More Than Ever
Nonprofit fundraising operates on a brutal cost-to-benefit ratio. Research suggests nonprofits spend approximately $0.20 per dollar raised to retain existing donors, compared with roughly $1.50 per dollar to acquire new ones. That's a 7.5x difference.
When you can measure which channels drive which donors, you stop wasting money on acquisition tactics that don't work and double down on what does. You shift budget from expensive channels to efficient ones. You prove to your board that marketing isn't overhead—it's a revenue engine.
More importantly, transparent ROI reporting builds trust. When your board can see that every dollar invested in digital fundraising returned $5 in net revenue, suddenly they're willing to expand the budget. When donors see detailed campaign results, their confidence in your financial stewardship deepens.
The Four-Pillar KPI Framework for Nonprofits
Most nonprofit KPI frameworks are either too simplistic (just track total revenue) or too complex (track 50 metrics and drown in data). Here's the sweet spot: four pillars, each with 2–3 critical KPIs.
Pillar 1: Revenue Efficiency
How much does it cost to raise a dollar? This pillar focuses on cost discipline.
Cost Per Dollar Raised (CPDR)
Formula: Total Marketing Expenses ÷ Total Revenue Raised
Example: You spent $5,000 on a campaign and raised $20,000. CPDR = $5,000 ÷ $20,000 = 0.25 (or 25¢ per dollar raised)
Target: Nonprofits typically aim for CPDR of 0.20–0.40 (20–40 cents per dollar). Anything below 0.20 is excellent; above 0.40 signals inefficiency.
Net Fundraising Revenue
Formula: Total Revenue Raised - Total Campaign Costs
Why it matters: Gross revenue can look impressive while net revenue tells the real story. A $50,000 campaign that costs $30,000 nets $20,000. A $40,000 campaign costing $8,000 nets $32,000. The second is more efficient.
Pillar 2: Donor Health
Are your donors healthy (engaged, growing, stable) or sick (declining, shrinking, aging)? This pillar measures donor quality and loyalty.
Donor Retention Rate
Formula: (Number of Donors Who Gave More Than Once) ÷ (Total Donors at Start of Period) × 100
Example: You had 500 donors at the start of the year. 350 gave again. Retention rate = 70%.
Target: 40–50% is typical; 60%+ is strong. Since retention is 7.5x cheaper than acquisition, this metric matters more than raw donor count.
Average Donation Size
Formula: Total Revenue ÷ Total Number of Donations
Why it matters: If your average gift is declining, you're acquiring lower-quality donors or losing your major donors. Track this by segment (new vs. recurring, by source channel, by demographic).
Donor Lifetime Value (DLV)
Formula: (Average Gift Size × Average Donations Per Year × Average Donor Lifespan in Years)
Example: Average gift is $100, donors give 2x/year, average donor lasts 5 years. DLV = $100 × 2 × 5 = $1,000.
Why it matters: A donor acquired for $50 (acquisition cost) with a $1,000 lifetime value is a 20:1 return. This justifies investment in retention.
Pillar 3: Growth & Acquisition
Are you reaching new donors and growing your base?
Donor Acquisition Cost (DAC)
Formula: Total Marketing & Fundraising Costs ÷ Number of New Donors Acquired
Example: $10,000 spent to acquire 200 new donors. DAC = $10,000 ÷ 200 = $50 per donor.
Target: Benchmarks vary, but industry-wide averages range from $35–$100 depending on channel and nonprofit type. Compare your DAC by channel (email DAC vs. Facebook DAC vs. event DAC) to identify which is most efficient.
New Donor Count & Growth Rate
Formula: (New Donors This Period - New Donors Last Period) ÷ New Donors Last Period × 100
Why it matters: A stable DAC with declining new donors signals market saturation. Growing donors with rising DAC signals acquisition inefficiency.
Conversion Rate
Formula: (Number of Donations) ÷ (Total Website Visitors) × 100
Example: 10,000 website visitors, 200 donations. Conversion rate = 2%.
Why it matters: Tracks how effectively your digital presence converts awareness into action. A 2% rate is typical for nonprofits; 3%+ is strong.
Attribution Basics: Which Channel Gets Credit?
Attribution is the practice of assigning credit for a donation to the marketing touchpoint(s) that influenced it. It's where most nonprofits stumble.
The Attribution Problem
Here's what typically happens: A donor sees your email on Monday. They ignore it. They see a Facebook ad on Wednesday targeting nonprofit supporters. They click but don't donate. On Friday, they search "donate to [your nonprofit]" on Google and land on your site organically. They donate.
Your email platform claims credit. Facebook claims credit. Google Analytics claims credit. Each platform inflates its own importance because that's how they're programmed. This is called ad platform bias platforms systematically over-report their contribution.
Without proper attribution, you can't answer these critical questions:
Is email actually driving conversions, or is it just awareness-raising for other channels?
Should I reduce Facebook spend if donors aren't converting directly from ads?
Which combination of channels works best together?
Three Attribution Models for Nonprofits
You have options. Most large nonprofits use multi-touch. Most small nonprofits start simpler.
Model 1: Last-Click Attribution
Credit 100% of the donation to the last channel the donor touched before converting
Pros: Simple, easy to implement
Cons: Ignores all upstream awareness-building work; undervalues email and content; overvalues final ad/organic search
When to use: Small nonprofits with limited resources; single-channel campaigns
Model 2: First-Click Attribution
Credit 100% to the first channel the donor encountered
Pros: Values awareness and top-of-funnel content
Cons: Ignores nurture work in the middle; overvalues cold outreach
When to use: New donor acquisition campaigns where brand awareness is critical
Model 3: Multi-Touch Attribution (40-20-40 or Time Decay)
Credit 40% to first touch, 20% to middle touches, 40% to last touch
Or: Weight credit based on time (recent touches weighted higher)
Pros: Reflects reality of multi-step donor journeys; balances awareness and conversion
Cons: Requires better tracking; more complex analysis
When to use: Mid-sized to large nonprofits with multiple fundraising channels
D4NP Case Study: Sivananda Yoga Ashram, a 60-year-old nonprofit, was running email, Google Ads, and Facebook simultaneously. Before attribution, their finance team thought Facebook was driving 60% of revenue. After implementing multi-touch attribution via donor database tagging, they discovered Facebook was only driving 20% (largely as a retargeting channel). Email, combined with organic search, drove 70%. They reallocated budget away from Facebook prospecting into email nurture and saw their donor acquisition cost drop from $85 to $52 per donor in six months.
Cost Per Donor Acquired: Your North Star Metric
Of all the metrics in your KPI framework, donor acquisition cost deserves special attention because it's actionable and directly comparable across channels.
How to Calculate and Optimize It
Formula: Total Campaign Costs ÷ Number of New Donors Acquired = DAC
Example breakdown:
Email campaign cost: design ($200), email platform ($50), copywriting labor (0, you did it), total = $250
New donors from email: 15
DAC = $250 ÷ 15 = $16.67 per donor
Compare this across channels:
Email DAC: $16.67
Google Ads DAC: $45
Facebook DAC: $62
Event DAC: $120
Suddenly you see email is 3.6x more efficient than Facebook. This data drives budget reallocation.
Benchmarking and Improvement
Industry averages for nonprofits typically fall between 1.5–3% annual donor acquisition rate. If you acquire 50 new donors and have a donor base of 2,000, your acquisition rate is 2.5%. That's healthy.
Benchmarks by channel (rough ranges):
Email: $15–$40 DAC
Organic search: $20–$50 DAC
Google Ad Grants (if eligible): $5–$15 DAC (subsidized by Google)
Paid social: $30–$80 DAC
Events: $80–$200 DAC (higher cost but builds relationships)
If your DAC is significantly higher than benchmarks, investigate:
Are you targeting the right audience?
Is your message resonating? (Low conversion rate suggests poor messaging)
Are you using the right channel for your donor demographic?
Is your website optimized for conversion? (Mobile-friendly, clear CTA, trust signals)
Reporting ROI to Your Board: The One-Page Dashboard
Your board doesn't want a 40-slide data deck. They want to know three things: Are we raising more money? At what cost? Are we improving?
The Board-Ready Dashboard Format
[Your Organization Name] — Digital Fundraising Performance Dashboard | Q1 2026
Headline Metric:
Overall Fundraising ROI: 5.2:1 (Every $1 invested returned $5.20 in net revenue)
Supporting Metrics (table format):
Channel Performance (simple bar chart): Show ROI by channel:
Email: 8:1
Google Ad Grants: 12:1
Organic Social: 3:1
Paid Social: 2.5:1
Narrative (2–3 sentences): "Digital fundraising delivered strong Q1 results with a 35% increase in net revenue compared to last year. Improved donor retention (68%, up from 62%) reduced acquisition cost to $92 per donor despite a 31% increase in gross revenue. Email remains our most efficient channel (8:1 ROI), while organic social shows opportunity for optimization."
Board Reporting Cadence
Monthly: Internal team review (identify issues early)
Quarterly: Board packet (highlight trends, strategic insights)
Annually: Full audit (what worked, what didn't, next year's strategy)
Quarterly reporting is ideal because it smooths out monthly volatility while keeping boards informed.
Setting Up Attribution Without Enterprise Software
You don't need Salesforce, HubSpot, or expensive attribution platforms to get started. Most nonprofits can implement basic attribution with free tools.
The Free Stack
Google Analytics 4 (Free)
Set up campaign tracking using UTM parameters (utm_source, utm_medium, utm_campaign)
Example: A Facebook ad link becomes: yoursite.org/donate?utm_source=facebook&utm_medium=paid&utm_campaign=holiday_2025
GA4 will show you which source drove traffic and conversions
Google Sheets + CRM (Minimal Cost)
Use your donor database (even a spreadsheet) to tag every new donor with their "source" (email, Facebook, Google search, event, etc.)
Create a monthly sheet: New Donors | Source | Amount | Date Acquired | Subsequent Gifts
This becomes your attribution table
UTM Parameter Tagging Discipline
Create a standardized UTM naming convention: utm_source=email/facebook/google, utm_medium=paid/organic/newsletter, utm_campaign=[specific campaign name]
Tag every external link (emails, ads, social posts, events)
This allows GA4 to automatically attribute traffic to source
Data Quality Requirements
For attribution to work, you need:
Complete tagging: Every donor's source is recorded
Consistent terminology: Don't call one source "email" and another "newsletter"
Segregation of new vs. existing: Only count new donors in acquisition cost
Regular audits: Check data quality monthly (are all gifts tagged? any data entry errors?)
Start Measuring, Start Improving
Here's the truth: perfect data is the enemy of good data. Many nonprofits wait for the perfect system before measuring anything. You don't have that luxury. Your board needs visibility. Your donors need transparency. Your mission needs every dollar to count.
Start today with what you have. Tag your campaigns with UTM parameters. Keep a monthly spreadsheet of new donors by source. Calculate your cost per donor acquired. Share one number with your board: your overall fundraising ROI.
Small improvements compound. A nonprofit that improves donor retention from 55% to 60% can reduce acquisition cost by 10–15% over time because fewer donors are churning. A nonprofit that identifies its most efficient channel (say, email at 8:1 ROI) and shifts budget from poor performers (say, event at 2:1 ROI) can multiply impact without raising overall budget.
This is leverage. Measurement is how you find it.
Need help auditing your nonprofit's digital performance or building a KPI dashboard? Digital For Nonprofits works with organizations to assess digital maturity, set realistic KPI benchmarks, and build data infrastructure that scales. We've helped mid-sized nonprofits cut donor acquisition cost by 20–30% in six months simply by making their data visible.
Key Takeaways
Use the four-pillar KPI framework (revenue efficiency, donor health, growth, engagement) rather than tracking dozens of metrics
Cost per donor acquired is your actionable metric; track it by channel to identify where to allocate budget
Multi-touch attribution prevents channel misallocation; start with even-split (40-20-40) if you can't do sophisticated modeling
Board dashboards work best as one-page summaries with headline ROI, supporting metrics, and quarterly cadence
Measurement is a habit, not a project. Start simple (Google Sheets + UTM tagging), improve over time