
A practical KPI framework for NGOs to measure nonprofit digital marketing ROI, track cost per donor, understand attribution, and report to your board.
80% of India's top 100 nonprofits score low on digital maturity, and yet most are now running digital campaigns of some kind: paid search, email newsletters, social media, Google Ad Grants. The investment is real. The measurement, in most cases, is not. According to D4NP'sState of Nonprofits Digitization Report 2025, only 13% of Indian nonprofits track digital impact in any structured way. The result is a sector spending money on digital without being able to defend, scale, or optimise that spend.
This post gives your NGO a working system to measure digital marketing ROI. It covers a four-tier KPI framework, how to calculate cost per donor acquired (CDA), how attribution models work, and how to present this data to your board in a way that drives decisions. No data team required.
Why ROI Looks Different for Nonprofits
The commercial ROI formula is clean: (Revenue - Cost) / Cost. For nonprofits, it's more layered. Your returns aren't just financial. A campaign that drives 300 volunteer sign-ups, generates 80 petition completions, and earns coverage in a state newspaper has created real organisational value, even if no donation was directly attributed to it.
Two types of ROI are worth tracking in parallel. Fundraising ROI measures rupees raised per Two types of ROI are worth tracking in parallel: Fundraising ROI, which measures rupees raised per rupee invested, and Social Return on Investment (SROI), which quantifies broader socio-economic impact alongside financial measures. SROI modelling can be sophisticated, but even a simplified version, such as the estimated media value of digital reach, gives your board a richer picture of what the digital programme is producing.
India’s social sector funding has grown steadily, private spending reached about INR 131,000 crore in FY2024, and the sector still faces a large funding gap relative to estimated need . Measuring digital ROI isn't a reporting exercise. It's what enables you to make the case for investing in that infrastructure.
The KPI Framework for Nonprofits: Four Tiers That Tell the Full Story
Most NGO marketing teams default to tracking what's visible: website sessions, Instagram likes, email open rates. These numbers feel good. They don't tell you whether your digital investment is working. The framework below organises every relevant metric into four tiers, from broad awareness down to mission-level impact, so your team tracks a coherent story rather than disconnected data points.
How to use this framework: start by identifying which Tier 3 and Tier 4 metrics your organisation currently has no visibility on. Those are your measurement gaps. Configure goal tracking in Google Analytics 4 (GA4) for every donation form, registration page, and sign-up flow on your website. Without conversion goals, all you have is traffic data. Traffic data is Tier 1. It's a starting point, not a measure of effectiveness.
Two tools make this framework actionable at near-zero cost. Google Analytics 4 tracks your full website funnel for free. Google Looker Studio (also free) connects GA4, Google Ads, Search Console, and your email platform into a single auto-refreshing dashboard. Both are available to any NGO with a Google account. If your organisation is eligible for Google for Nonprofits, theGoogle Ad Grant gives you up to $10,000 (approximately ₹8.5 lakh) per month in free search advertising, with full GA4 attribution built in.
How to Calculate Cost Per Donor Acquired
Cost Per Donor Acquired (CDA) is the single most actionable NGO marketing metric available to you. It answers the question every board member and programme director eventually asks: how much does it cost us to bring one new donor into our community?
The calculation is straightforward. Divide your total digital marketing spend for a given period by the number of new donors acquired during the same period.
A Worked Example in INR
An NGO runs a 90-day digital campaign. Here is the spend breakdown:
• Google Ads (via Ad Grant): ₹0 (grant-funded, up to ₹8.5 lakh/month available)
• Instagram Promoted Posts: ₹18,000
• Email Platform Subscription: ₹3,500
• Content Creation (freelance copywriter + designer): ₹12,000
• Campaign-Specific Landing Page Design: ₹6,000
• Total Digital Marketing Spend: ₹39,500
The campaign generates 74 new donors.
Is ₹534 a good CDA? That depends on Donor Lifetime Value (DLV). If your average donor gives ₹2,000 per year and stays engaged for 3 years, their DLV is ₹6,000. A CDA of ₹534 against a DLV of ₹6,000 is an 11:1 ratio, strong for any fundraising model. The guiding rule: your DLV must be at least 5 times your CDA for sustainable acquisition economics.
Channel-Level CDA: Where the Real Insight Lives
Aggregate CDA is useful. Channel-level CDA is where you actually make decisions. Break your spend and donor acquisition numbers down by channel to find which platforms are earning their investment and which ones aren't.
*Organic social CDA is estimated using staff time cost. ₹2,500/month staff allocation ÷ 5 organic donors = ₹500.
This table makes the answer obvious. The Google Ad Grant and email channel are dramatically more efficient than paid social. If this NGO shifts ₹9,000 of its Instagram spend into email list growth and Ad Grant optimisation, CDA across the portfolio improves materially. That's the kind of insight that justifies the time spent setting up measurement.
Attribution Basics: Which Channel Gets Credit for the Donation?
When someone donates to your NGO online, they've almost certainly interacted with your organisation more than once before clicking the donate button. They may have discovered you through a Google search, read your impact report, received two email newsletters, and then donated after seeing an Instagram story. Attribution is the process of deciding which of those touchpoints gets credit for the conversion.
It matters because it directly shapes where you invest your budget. If Instagram always gets last-touch credit, you'll over-invest in Instagram and under-invest in the Google Ad Grant that actually introduced the donor to your work. Understanding attribution prevents that structural misallocation.
Which Model Should Your NGO Start With?
If your organisation is building measurement from scratch, start with last-touch attribution because it's the default in GA4 and requires no additional configuration. As your data confidence grows, move to multi-touch linear attribution to get a fairer picture of how your channels contribute to each other. This is especially important for organisations using Google Ad Grants, where the typical donor journey looks like: search ad > website visit > email sign-up > email click > donation. Last-touch gives all credit to the email. Multi-touch acknowledges that the Ad Grant started the relationship.
A practical note on platform attribution bias: every ad platform, Google, Meta, LinkedIn, reports its own attribution data and will typically overclaim. Run a Google Ads report and a Facebook Ads report simultaneously and you'll often find a combined reported conversion count higher than your actual CRM total. Always use GA4 or your CRM as the single source of truth. Platform dashboards are directional guides, not authoritative records.
UTM Parameters: The Foundation of Attribution for Any NGO
UTM parameters are short tags added to the end of any URL you share in a campaign. They tell GA4 exactly which channel, campaign, and source drove each website visit. Without them, GA4 cannot differentiate between a visitor who came from your email newsletter and one who came from an Instagram post. Both show up as 'direct' traffic.
Every URL you share in a digital campaign should carry five UTM tags:
• utm_source: The platform (e.g. google, instagram, mailchimp)
• utm_medium: The channel type (e.g. cpc, email, organic_social)
• utm_campaign: The campaign name (e.g. giving_tuesday_2026)
• utm_content: The specific creative or ad variant (e.g. banner_v1, cta_donate_now)
• utm_term: The keyword, for paid search only
Google's freeCampaign URL Builder generates UTM links in seconds. A consistent UTM naming convention, applied to every campaign URL your team shares, is the single highest-impact tracking action available to a resource-constrained NGO.
Reporting Digital Marketing ROI to Your Board
Board members are not marketing professionals. They're trustees, programme leaders, sector experts, and governance stewards evaluating organisational health and resource allocation. What they need from a digital marketing report is not a breakdown of click-through rates or social impressions. They need to know three things: did our digital investment move the mission forward, was it worth the money, and what do we do next?
The most common mistake NGO communications teams make in board reporting is presenting channel-level activity data without connecting it to outcomes. A slide showing 'Instagram reach: 42,000 impressions' means nothing to a trustee unless it's followed by 'which contributed to 18 new donors at a cost of ₹780 per acquisition.' The numbers exist to tell a story about mission progress and resource efficiency.
The Quarterly Digital Report: What to Include
A strong quarterly digital report covers four sections and can be delivered in one page or a 10-minute board slot:
Translating Metrics into Mission Language
The most effective NGO board reports use a simple translation pattern for every key metric. Here's how it works:
Visual dashboards reduce the time required to maintain this reporting habit. Google Looker Studio connects GA4, Google Ads, Search Console, and your email platform into a single auto-refreshing dashboard. A one-time setup of 2-3 hours produces a live board-ready report your entire leadership team can access at any point. Pair it with a one-page written narrative each quarter and you've built a reporting culture that the majority of Indian NGOs haven't yet established.
If your nonprofit needs support setting up this infrastructure, from GA4 goal configuration to Ad Grant attribution reporting, D4NP works with organisations at every stage of digital maturity.Take our free digital maturity assessment to understand exactly where your organisation stands and which measurement gaps to close first.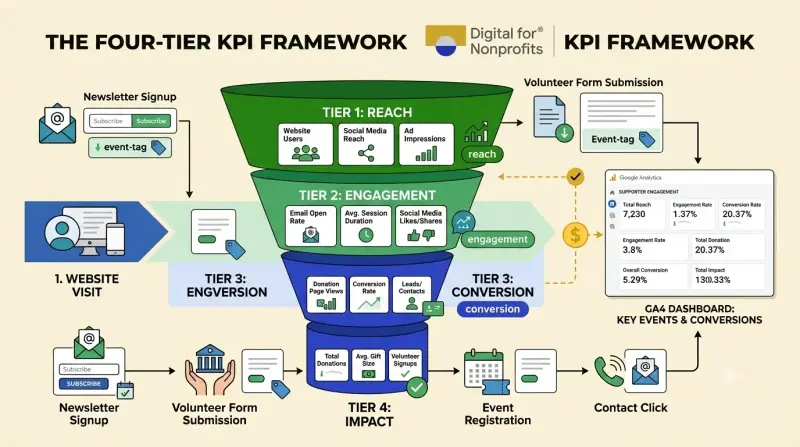
The Path Forward: Measure, Learn, Scale
The gap between NGOs that are growing their digital fundraising and those that are stagnating is not a creative gap or a budget gap. It's a measurement gap. Organisations that know their CDA, track their attribution, and report outcomes to their boards in mission language are the ones securing budget for their next campaign, attracting major donors who want to see accountability, and building the digital self-reliance that D4NP's model is designed to enable.
D4NP's research is direct: 83% of Indian NGOs forfeit ₹1 crore or more in free digital advertising annually by not activating Google Ad Grants. Measurement is what makes the case for activation. When you can walk into a board meeting and show that a ₹39,500 digital campaign produced 74 new donors at ₹534 per acquisition, scaling that investment and activating every available tech grant becomes an easy board decision.
Your mission deserves a digital programme that is as rigorous, evidence-based, and outcome-focused as the work you do on the ground. The four-tier KPI framework, a tracked CDA, a basic attribution model, and a quarterly board report are everything you need to build that programme. Start with one measurement this week, and the rest will follow.